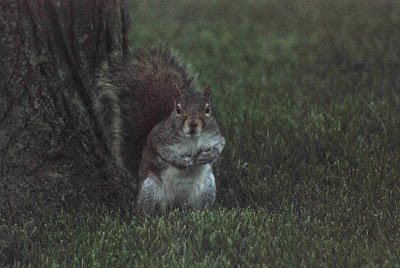
So last night in class we learned about histograms. A histogram is a chart that shows you the balance between light, dark & midtone colors in your photography. Depending on your camera, this graph is viewable either when you take a photo, or when you review your photo on the back of your screen.
In cases where you've shot pictures where that are either under or over exposed, you can quickly correct this in iphoto by manipulating the histogram. Below are the results of correcting the squirrel photos I took last week that were severly underexposed.


No comments:
Post a Comment